Abang on Earth

NASA Space Apps Challenge 2026 · Seoul

MODIS and VIIRS fires in Indonesia, 2001 to today.

Two satellites count the same fires very differently: VIIRS reports about 5 times more detections in Indonesia. We map both, month by month, and harmonize them into one burning activity calendar for any country or province, with the error stated. A convolutional model, trained on real pairs of MODIS and VIIRS scenes, draws VIIRS-style fire points for 2002 to 2012, before VIIRS existed. Underneath: forest loss, oil palm, peat and burned area.

First slide of the presentation deck: Abang on Earth. See the fires of the past the way we see the fires of today.

Presentation deck

See the fires of the past the way we see the fires of today.

Seven slides: the problem, our contribution, how it works, and who can use it.

Open the PDF Download the PowerPoint

What the app shows now

Real fires, one scale, and the land underneath.

A full-screen map of Indonesia with real MODIS (2001 on) and VIIRS (2012 on) fire detections from NASA FIRMS, one month at a time, and harmonized monthly counts for each province. The harmonized counts come from a province-by-month ratio baseline: before 2012 we scale MODIS by the VIIRS/MODIS ratio of each province and calendar month. On years held out of the fit its error is 12.6% for the national monthly count and 28.9% for the median province's monthly count. It is a baseline, not our model.

Under the fires you can switch on forest loss (Hansen), oil palm by planting year (Descals), peat, burned area, forest history since 1990 (JRC) and tree-plantation conversion.

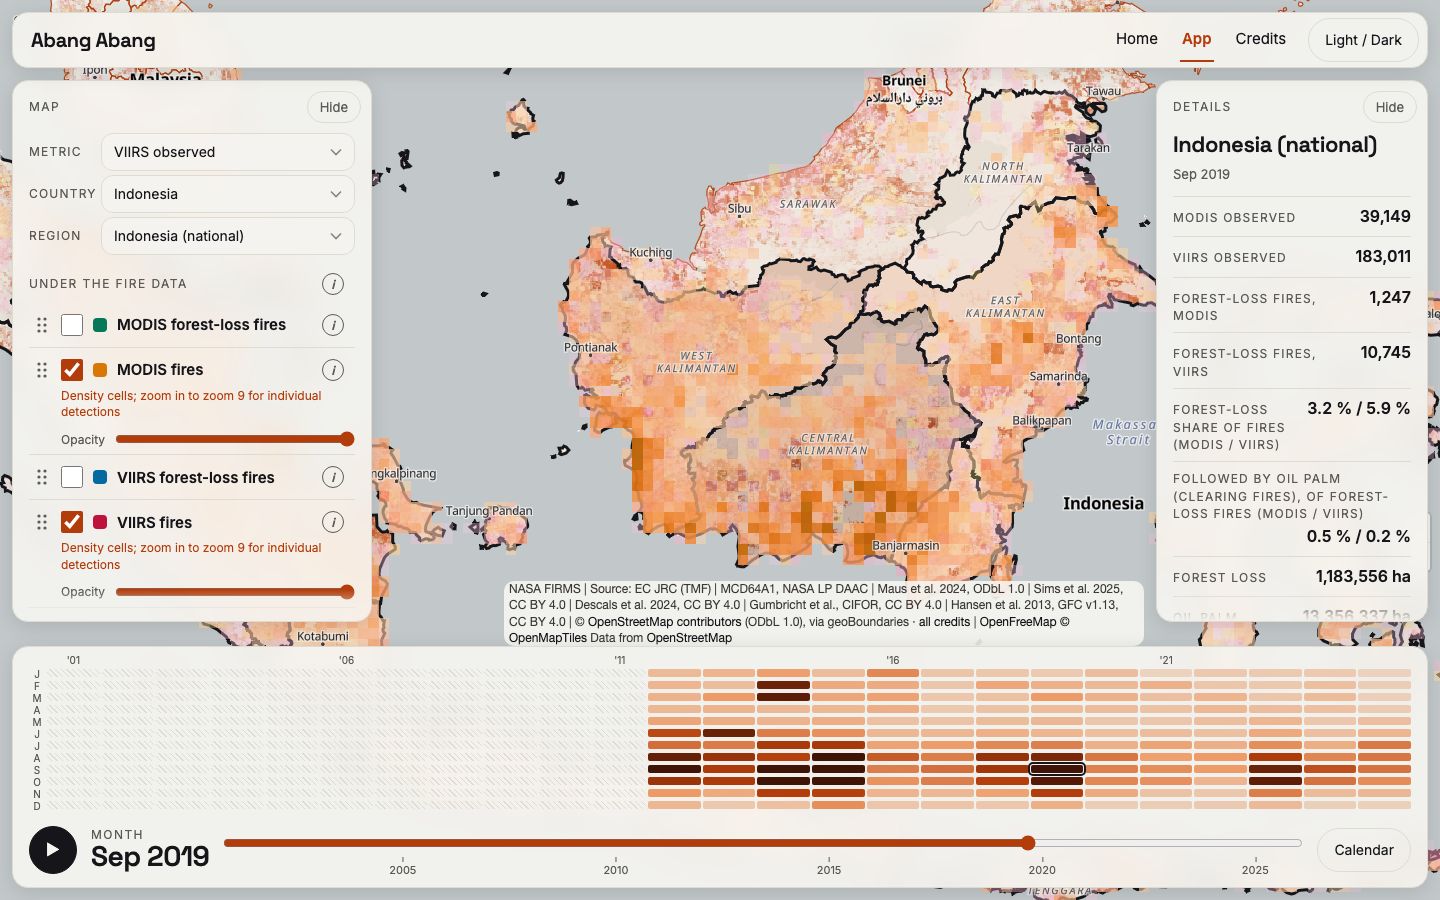
Screenshot of the app: Borneo in September 2019 with monthly fire density from MODIS and VIIRS, the layer panel on the left with Day and Night boxes and the Harmonized VIIRS row, the details card on the right and the month calendar below.

Our model

A convolutional model that reads MODIS and predicts VIIRS.

We aligned 1,017 pairs of MODIS and VIIRS night scenes of the same place, taken less than 30 minutes apart, on one 375 m grid; 971 of them gave 32,914 training tiles. A small convolutional network (438,678 parameters) learns from these pairs to predict the VIIRS radiance of each 375 m cell from the raw MODIS radiance. To our knowledge, and within our documented search, it is the first learned model of this kind. We ran it on 46,125 Aqua MODIS night scenes, and the map shows the result for July 2002 to January 2012 as the layer Harmonized VIIRS: 608,298 fire points for years before VIIRS existed. It is experimental and night only; the full evaluation is in the technical report. The charts and counts use the ratio baseline.

  1. MODIS night scene1 km pixels, raw radiance at 4 and 11 µm
  2. Aligned pairs1,017 MODIS–VIIRS pairs, same place, 30 minutes apart or less
  3. Convolutional modela small U-Net with 438,678 parameters
  4. VIIRS-like radiance375 m cells, learned from real VIIRS
  5. Harmonized VIIRS608,298 fire points on the map, 2002 to 2012
How the model works: a MODIS night scene goes in, and VIIRS-style fire points for the years before VIIRS come out. Experimental.

Facts we tested

Six facts about fire in Southeast Asia.

Each button opens the map at the place, month and layers that show the fact; press Play there to watch it happen. A detection is one hot pixel reported by a satellite; every count here is a count of detections, not of fires.

Fact 1 of 6

Joining the MODIS record to the VIIRS record makes a jump of about 5 times

5.04× → 1.04×

Indonesia's yearly detection count from 2011 to 2012. When the MODIS record is simply joined to the VIIRS record the count jumps 5.04 times in one year. After we scale MODIS to the VIIRS level it changes 1.04 times. On years we left out of the fit, the scaled yearly totals are within about 6% on average (5.7%).

What to keep in mind. A small step after scaling is expected, because the ratio is fitted on VIIRS levels. Only the held-out years test it: the worst year is off by about 15%, and 2012 itself comes out about 11% too high.

Source: NASA FIRMS MODIS and VIIRS detections (CC0), Indonesia 2003–2025; scaling is our ratio baseline. Details on Credits.

Open on the map and press Play

Press Play: until December 2011 only MODIS points are drawn; from January 2012 VIIRS points appear and the map fills up.

Indonesia, detections per year 2003 to 2025: the joined record jumps about 5 times in 2012, the scaled record does notTwo lines. Joined as recorded: low until 2011 (57,427 detections), 289,381 in 2012. Scaled to the VIIRS level: 281,805 in 2011 and 292,852 in 2012. After 2012 both lines are the same VIIRS counts.0300k600k900k200320082012201720212025joined: jumps 5.04×Joined as recordedScaled to VIIRS level
Indonesia, detections per year. The line “joined as recorded” is MODIS to 2011 and VIIRS from 2012; after 2012 both lines are the same VIIRS counts.

Fact 2 of 6

Indonesia burns more in El Niño years

2.16×

MODIS detections per year in Indonesia, 2001–2025. The 7 El Niño years (Aug–Oct Pacific warmth index of 0.5 or more) average 95,205 detections; the 12 neutral years average 44,110. That is 2.16 times. Against all other years together, which include 6 La Niña years (24,278), it is 2.5 times.

What to keep in mind. There are only 25 years, and 2015 alone has 149,770 detections; the rank correlation between the index and the yearly count is 0.73 (0.70 without 2015). This is an association, not proof of cause.

Source: NASA FIRMS MODIS detections (CC0); El Niño years from a Pacific warmth index (Aug–Oct, 0.5 or more). Details on Credits.

Open on the map and press Play

Press Play: the calendar shows the dark El Niño years for Indonesia; the map fills with fires from August to October 2015 and is quiet in 2016.

Indonesia, MODIS detections per year 2001 to 2025, El Niño years marked25 bars. The seven El Niño years 2002, 2004, 2006, 2009, 2015, 2018 and 2023 are orange; they average 95,205 detections. The 12 neutral years average 44,110 and the 6 La Niña years 24,278.050k100k150k2001200520102015202020252015: 149,770El Niño yearother year
Indonesia, MODIS detections per year. Orange bars are the seven El Niño years.

Fact 3 of 6

Two fire seasons, in opposite halves of the year

5.9 months

MODIS 2001–2025, each year weighted equally. Myanmar, Laos and Vietnam have their peak month in February to April, in all 25 of 25 years. Indonesia peaks in August to October. On average 75% of the mainland's fire falls in Feb–Apr and 65% of Indonesia's in Aug–Oct. The two peaks are 5.9 months apart; 6 would be exactly opposite.

What to keep in mind. Cambodia peaks in January–February, and Malaysia is flatter (43% of its fire in its three busiest months). Counts are detections, not burned area.

Source: NASA FIRMS MODIS detections (CC0), 10 countries. Details on Credits.

Open on the map and press Play

Press Play: fires appear on the mainland in February to April, then in Indonesia from August.

Share of a year's MODIS detections in each calendar month: Myanmar, Laos and Vietnam peak in Feb to Apr, Indonesia in Aug to OctFour lines over twelve months. The three mainland countries rise in February to April and are near zero from June to October. Indonesia is low from January to May and highest in August to October.0%25%50%JFMAMJJASONDMyanmar, Laos, VietnamIndonesiaFeb–AprAug–Oct
Share of a year's MODIS detections in each calendar month, mean over 25 years. Grey bands: Feb–Apr and Aug–Oct.

Fact 4 of 6

Where forest burned before it was cleared, oil palm followed more often

36% vs 28%

Sumatra and Kalimantan, forest lost from 2002 to 2011. Where MODIS saw a fire in the year of the loss or the year before, 36.1% of the lost forest was oil palm within ten years. Where it saw no fire, 28.1%. That is 1.28 times as often (range 1.19 to 1.38). Of everything the cleared forest became, oil palm is the only land use that is more common after fire: other farming is the same with or without fire (0.95), and mines (0.54) and logging (0.52) are less common. Across Indonesia, about 24% of the forest lost since 2001 was oil palm by 2021, mostly planted within three years of the loss.

What to keep in mind. This is an association. It does not show that a fire was set to plant oil palm. “No fire” means no fire seen by MODIS; small or cloud-hidden fires are missed. Most of the difference comes from fire in the year of the loss itself.

Source: Forest loss: Hansen et al. 2013 (CC BY 4.0); oil palm planting year: Descals et al. 2024 (CC BY 4.0); other land uses: Sims et al. 2025 (CC BY 4.0); fires: NASA FIRMS MODIS (CC0). Details on Credits.

Open on the map and press Play

Press Play: in Riau the orange fire points come and go with each dry season, while oil palm (green) spreads year by year from 2003.

Oil palm is the only land use that is more common where the forest burned before it was clearedFive bars of a ratio: the share of a land use among forest that burned and was then cleared, divided by its share among forest cleared without fire. Oil palm 1.28, other farming 0.95, shifting cultivation 0.66, mines and energy 0.54, logging 0.52. A dashed line marks 1.0, the same with or without fire.1.0 = same with or without fireOil palm1.28Other farming0.95Shifting cultivation0.66Mines and energy0.54Logging0.52less often after firemore often
How much more or less often each land use follows forest that burned before it was cleared, compared with forest cleared without fire. Sumatra and Kalimantan, forest lost 2002–2011.

Fact 5 of 6

VIIRS sees small fires that MODIS misses

86%

of VIIRS fire clusters (2012–2025, 11 countries) have no MODIS detection within 2 km on the same day; the range is 82–88% depending on how clusters are drawn. 57% of clusters are a single detection, and 95% of those are not seen by MODIS.

What to keep in mind. “Not seen” mixes small fires, a different overpass time and swath coverage; the same VIIRS sensor 50 minutes later matches only 53–70% in Indonesia.

Source: NASA FIRMS MODIS and VIIRS detections (CC0); Harmonized VIIRS is our own model output (CC BY 4.0). Details on Credits.

Open on the map and press Play

Press Play: night-time MODIS (orange) and VIIRS (red) points in Central Kalimantan build up to the September peak; VIIRS adds many small points.

About 86 percent of VIIRS fire clusters have no MODIS detection within 2 km on the same dayThree bars. All clusters: 86 percent not seen by MODIS, 14 percent seen. Single-detection clusters, which are 57 percent of all clusters: 95 percent not seen. VIIRS detections: 55 percent sit in clusters MODIS sees, 45 percent in clusters it does not.All VIIRS fire clusters86%14%Clusters with one detection (57% of all)95%5% seenVIIRS detections, by cluster45%55%not seen by MODISMODIS detection nearby
VIIRS fire clusters 2012–2025: share with and without a MODIS detection within 2 km on the same day.

Fact 6 of 6

Our experimental model draws the fires of 2002–2011 as VIIRS-style points

608,298 points

Harmonized VIIRS is an experimental layer: our own model reads MODIS Aqua night scenes (46,125 of them) and draws where a VIIRS-style sensor would have seen heat. The layer holds 608,298 points over 115 months, from July 2002 to January 2012, night passes only. It is experimental model output, not VIIRS data.

What to keep in mind. It exists for night passes only and covers Southeast Asia in two areas: Indonesia with its neighbours, and the mainland with the Philippines. Read the technical report for how it was made and what we tested.

Source: NASA MODIS Aqua night scenes (LAADS DAAC, NASA open data) and NASA FIRMS MODIS (CC0); the points are our own model output (CC BY 4.0). Details on Credits.

Open on the map

Periods of the real MODIS and VIIRS records and of the experimental Harmonized VIIRS layer, 2001 to 2025Three bars on a 2001 to 2025 axis. MODIS: January 2001 to December 2025. VIIRS: January 2012 to December 2025. Harmonized VIIRS, the experimental model layer: July 2002 to January 2012, 115 months and 608,298 points, night passes only.200120052010201520202025MODIS fire detections (real)VIIRS fire detections (real)Harmonized VIIRS (experimental)608,298 points, 115 months, night only
Periods covered by the real MODIS and VIIRS records and by the experimental Harmonized VIIRS layer. The site data has no point count per month, so the diagram shows periods, not monthly counts.

The team

Abang Abang

Portrait of Joshua Julian Damanik

Joshua Julian Damanik

AI / Robotics Engineer at CarbonSix

PhD in Aerospace Engineering, KAIST

Recognition

  • IEEE ICRA 2024 BARN Challenge1st place
  • The 3rd F1TENTH Korea Challenge7th place
  • NASA Space Apps Challenge 2025, Seoul Local EventRising Star Recognition

Open source

Abang on Earth is open source.